
Powered by GPS data from 250,000+ apps and 700 million+ devices, Movement Data reveals who is using your places and spaces, when, and how, giving your team the evidence to monitor activity, report outcomes, secure funding, drive commercial revenue, and plan with confidence.

Fully de-identified, aggregated; no PII captured
GPS-based; no phone signal required
Continuous data ingestion since January 2022


Most spaces have no reliable visitor data at all, or rely on observation and manual counters. Movement Data changes that, giving government, facility and venue operators, sport, right holders and planning teams the evidence to make decisions, drive partnerships, secure funding and demonstrate impact.
Real footfall and usage data for facilities, parks, trails and open spaces. Raw device data is continually processed and validated against the industry’s largest network of ground truth sources.
Go beyond visitor counts. See where people travel from, how long they stay, and which communities are underrepresented, so you can plan, invest and report with confidence.
Capture visitor data for spaces that have never been measured before, such as indoor facilities, parks, trails, coastlines and event grounds.
Back grant applications, capital proposals and partnership pitches with credible, independent data on visitor numbers, travel patterns and community reach.
The ActiveXchange team support each client to fully leverage a growing set of proven applications of this data to drive value and returns.
A comprehensive breakdown of who visits your spaces, when they come, how long they stay and where they travel from, delivered as a detailed report you can share across your team and with partners.
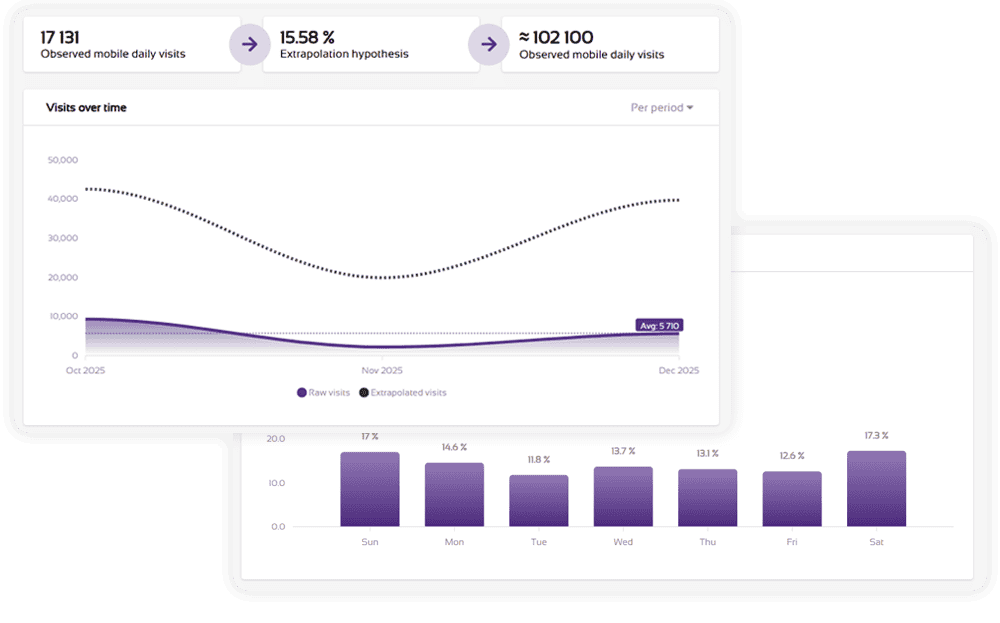
See how many people visit your spaces, when they come, and how that changes over time. Track daily and hourly patterns, compare weekdays to weekends, and identify peak periods to plan resources effectively.
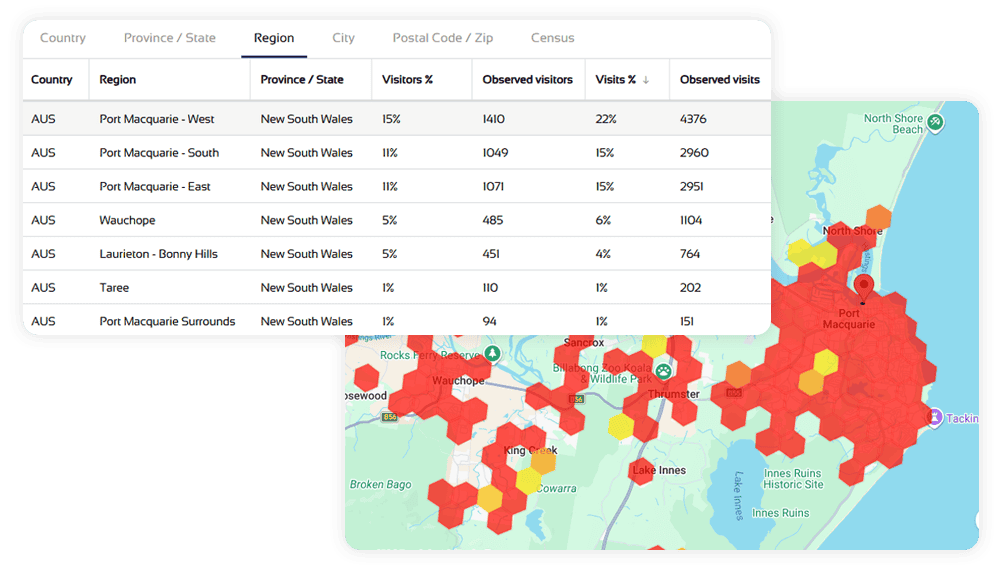
Understand where your visitors travel from by region, distance and local versus external split. See which communities your space is drawing in and where there are gaps in your catchment areas. This also includes international travellers to better understand inbound tourism, inform marketing initiatives and evidence economic impact.
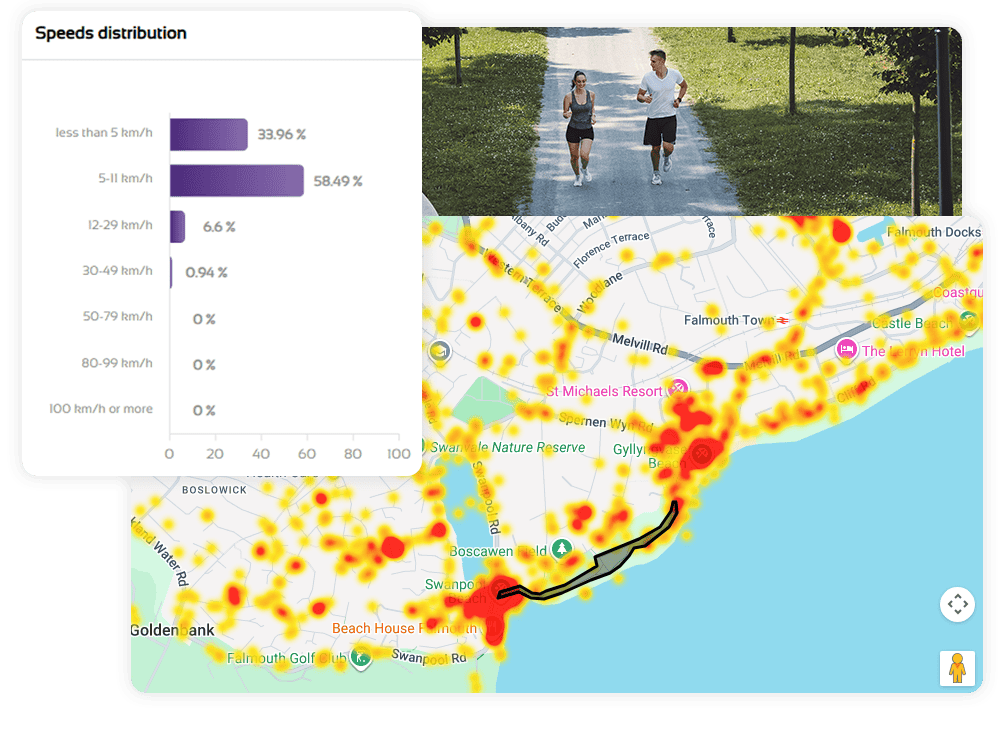
Go inside your space with data on how visitors move through it. Track entry and exit points, direction of travel and speed to understand how people actually use your facility, not just that they arrived.
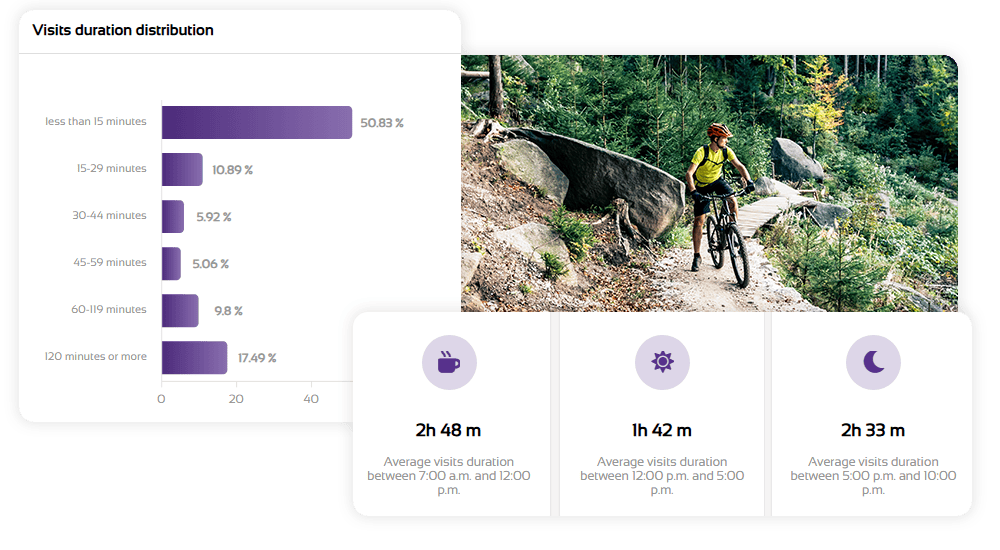
Find out how long visitors stay and how that varies by time of day, day of the week and visitor type. Longer dwell times signal deeper engagement, and shorter ones can highlight friction points worth addressing.
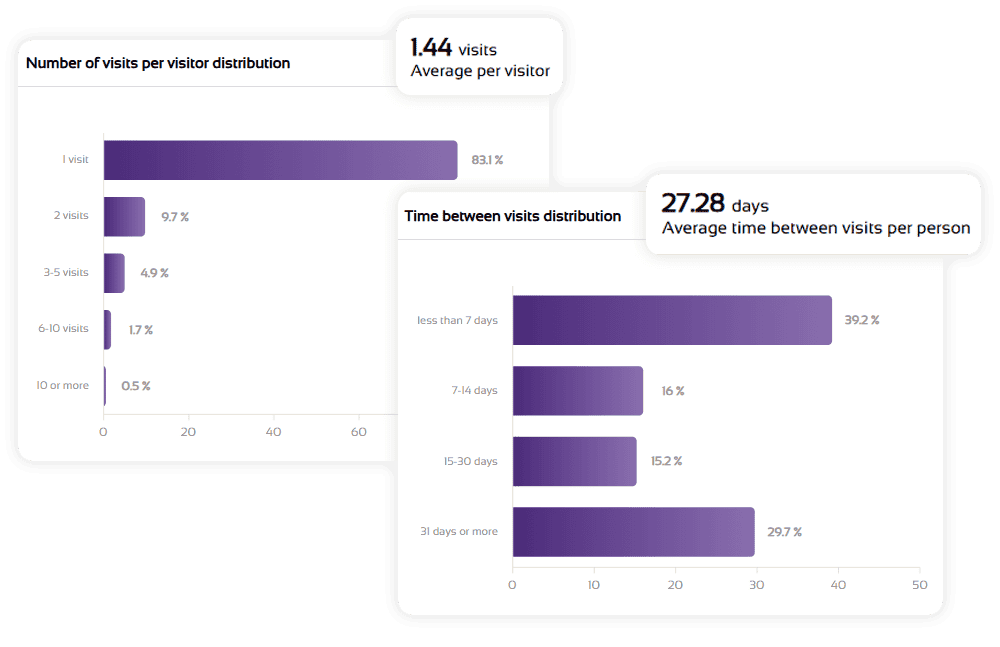
See how often the same visitors return over time and the average gap between visits. Understand whether you’re building a loyal, repeat audience or relying heavily on one-off visitors.
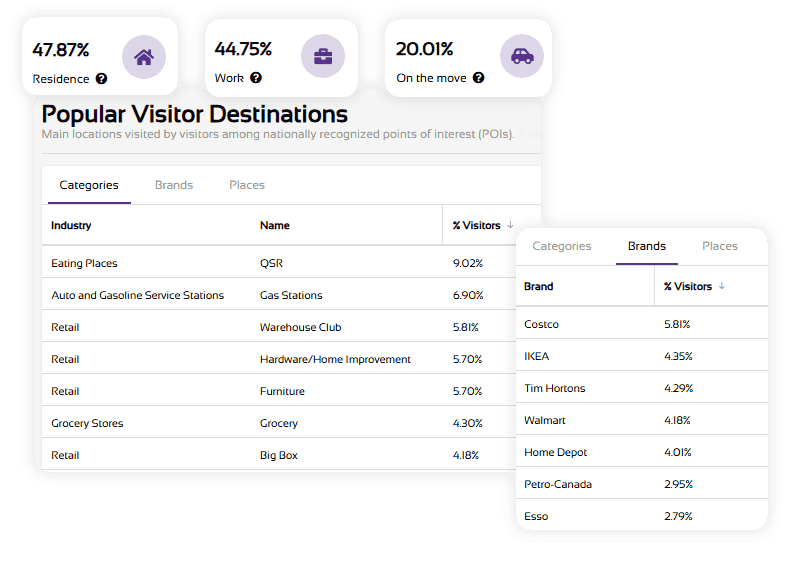
See where your visitors came from before they arrived and where they went afterwards, by category, brand and place. Understand the broader journey your audience takes around your space, and use that intelligence to identify partnership, sponsorship and commercial opportunities.
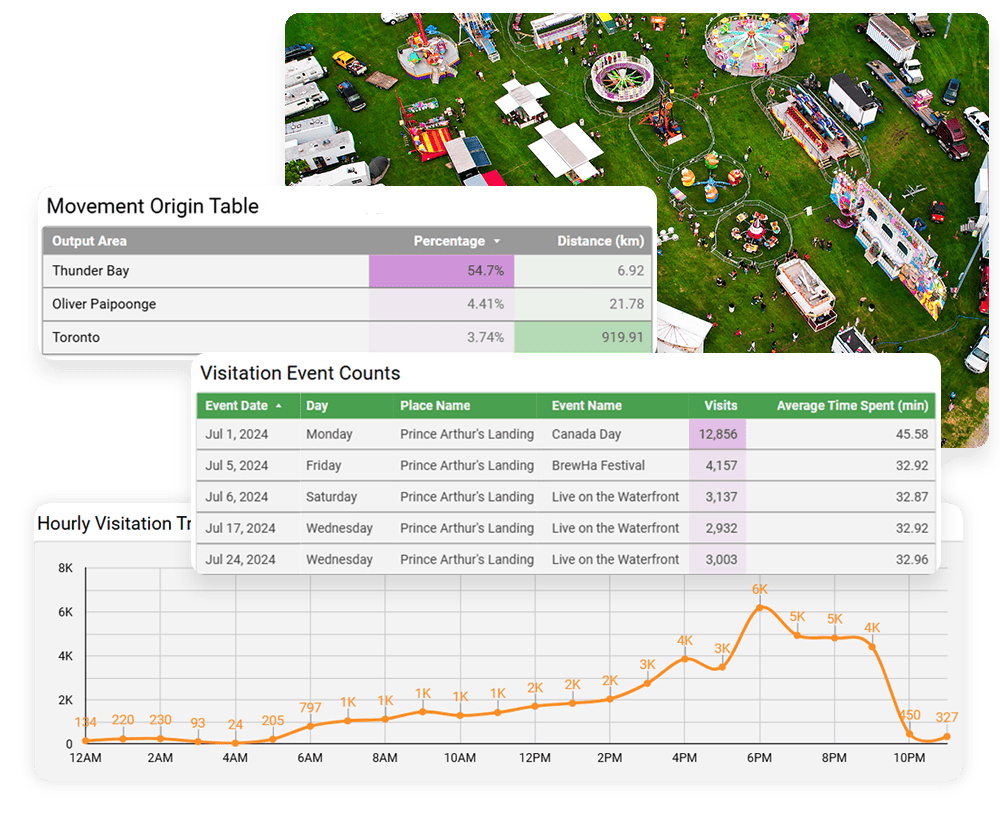
Measure the true reach and impact of your events with visit data specific to event days. Compare event periods against baseline activity, track peak arrival times and understand where your event audience travelled from, giving you the evidence to grow attendance, justify investment and attract sponsors.
By understanding inbound tourism and visits before and after, this is an effective way to evidence direct spend and economic impact of events (and far more reach with less cost than surveying).
The City of Thunder Bay uses Visit Reports and Event Analysis to drive smarter decisions across event planning and public space activation. Read more.
Hear from Ben Jones as he explains how Movement Data reveals where, when and how people move. See how these insights are being used to support planning, improve accessibility, and guide better decisions across communities.
Visit Reports are just the starting point. They can be extended with Community Reach for demographic and equity insights, and PartnerMatch for sponsorship and advertising intelligence.
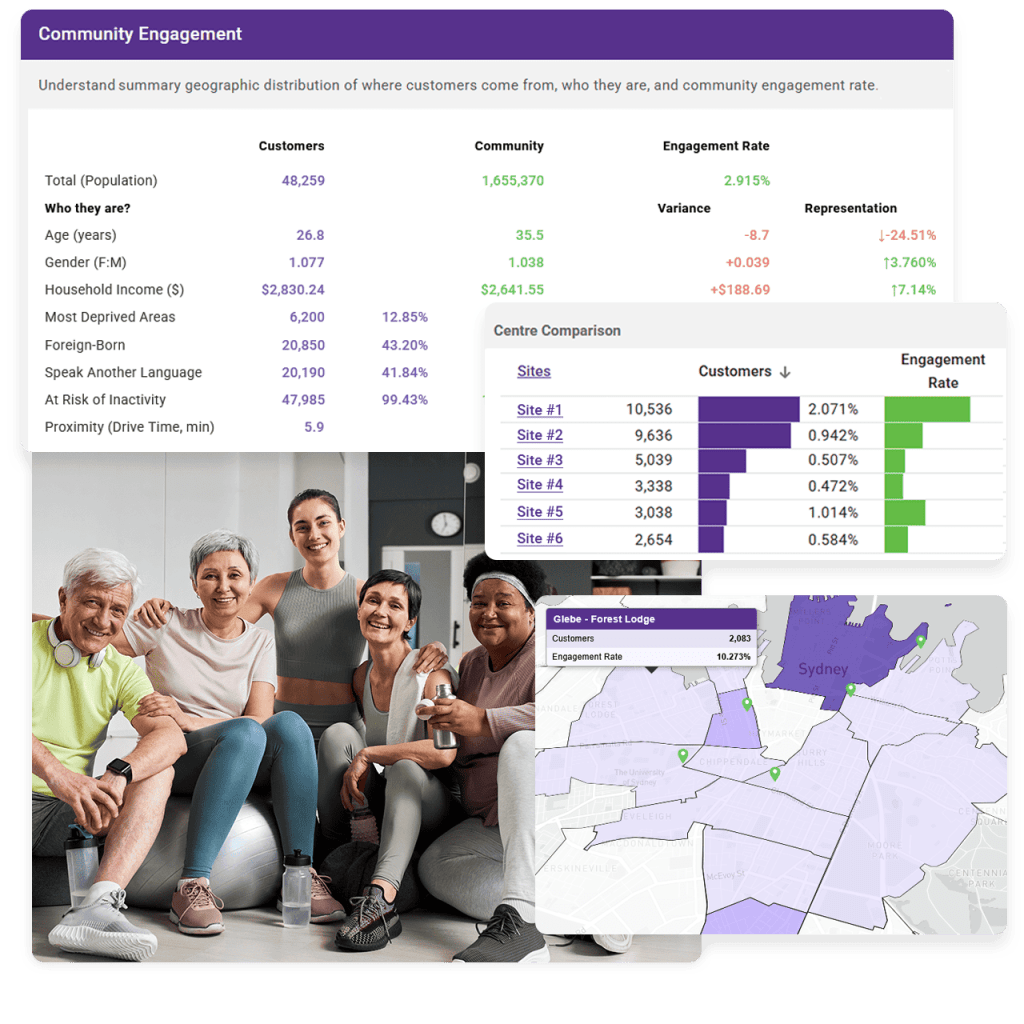
This dashboard extends Movement Data with rich socio-economic, demographic and consumer insights. It provides a deeper understanding of who is using a space, and helps identify groups that may be underrepresented or excluded.
Basketball England uses the Community Reach module to evidence participation from priority communities for 17 courts across Birmingham City. Read more.

By leveraging advanced consumer market profiling, this dashboard reveals which brand categories naturally align with the people using your spaces. It helps you understand audience value, identify the right commercial partners, and make a stronger case for sponsorship and advertising opportunities.
i-media uses the PartnerMatch module to help agencies & brands discover and connect with target audiences across their expansive Intelligent Motoring Media Network. Read more.

Andy Gattiker from South Downs National Park Authority discusses how Movement Data provides his team with “hard data to back up” assumptions about where visitors are travelling from to their parks and trails.
Dr. Nadia Al-Sabouni from Buckinghamshire Council discusses the various strategic and operational applications of Movement Data across sectors, and how the unique insights generated can support leaders and teams to make more informed decisions.
One of Tennis Canada’s most pressing strategic challenges are tennis “dead zones” – areas where demand for tennis exists but courts are scarce, inadequate or non-existent. Katie Matthews, Community Projects Coordinator, explains how Movement Data helps identify these areas.
A platform tool for monitoring movement activity across an area over time, showing you where and when communities come together. Track how usage changes by year, month, day and hour across a collection of sites, or simply switch on the nationwide heat map to explore activity levels anywhere in your country. It’s the fastest way to spot patterns, compare locations and identify where activity is growing or declining.
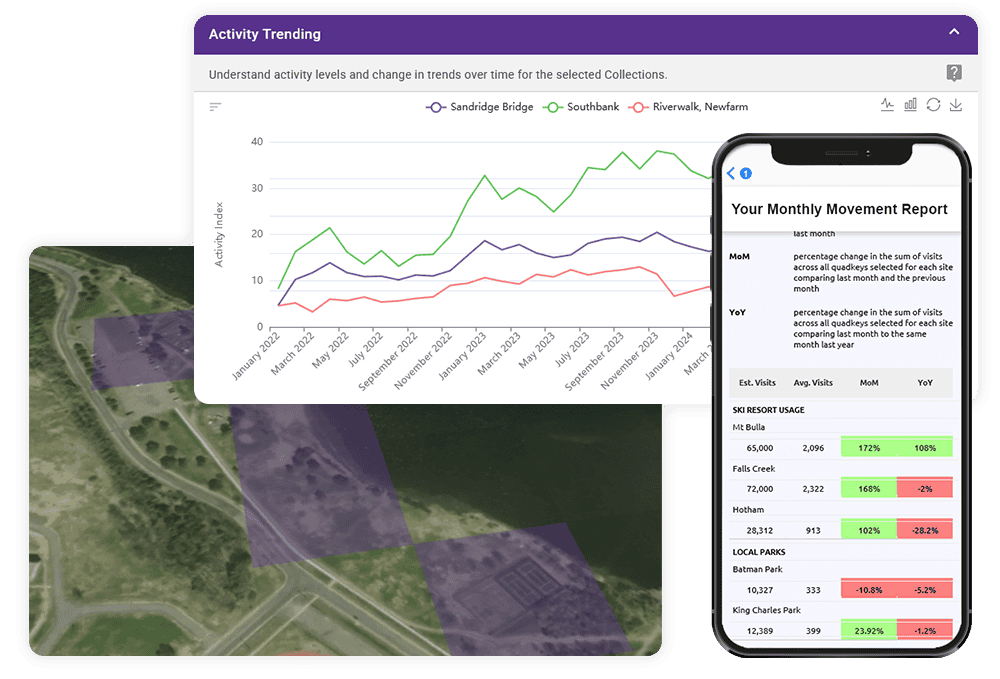
Set up collections of sites to monitor and compare activity over time. Break down trends by year, month, weekday versus weekend, and time of day, with historical data going back to January 2022.
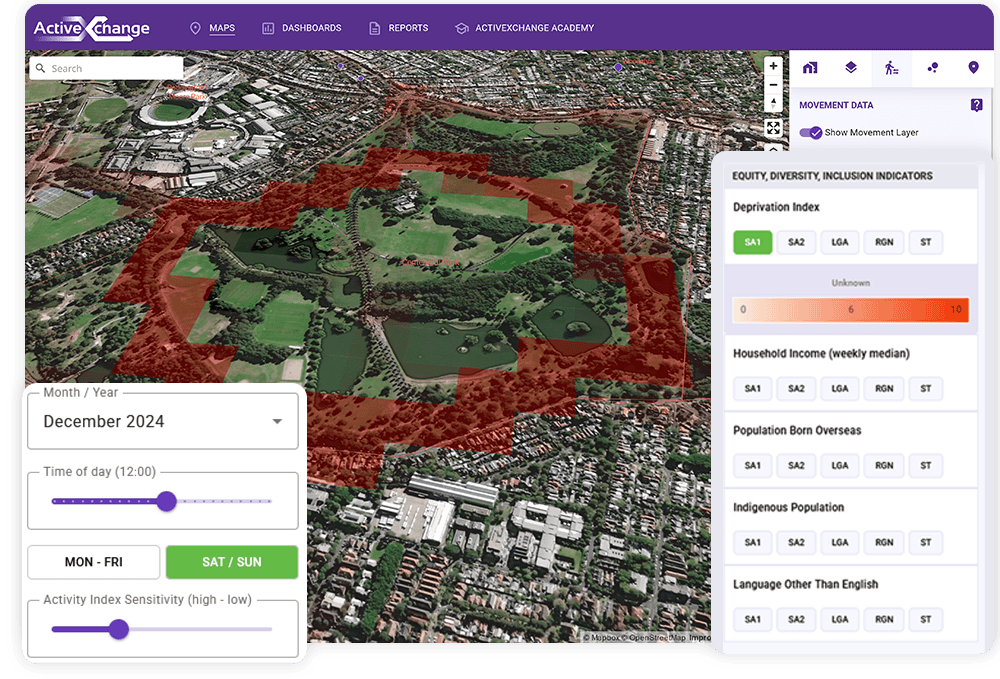
Switch on the heat map layer to explore movement activity across your entire country through 100m x 100m grids. Overlay satellite imagery, geographic boundaries, and equity and health indicators to add context to what you’re seeing.
Drowning Prevention Auckland/Aotearoa used Activity Trends to strategically deploy life-saving interventions at Auckland’s most dangerous rock fishing sites. Read more.
Export your data at any time in CSV format, or query directly into AWS or Google Cloud for deeper analysis and reporting.
Every member of your team can access the platform with no per-user licensing restrictions. Run as many analyses as you need, whenever you need them.
Receive a monthly email summary highlighting changes in activity across your monitored locations, so you never miss a significant shift.
By examining patterns of movement activity across different locations, times of day and seasons, Movement Data provides insights into where activity concentrates, how it changes over time, and who is using locations.

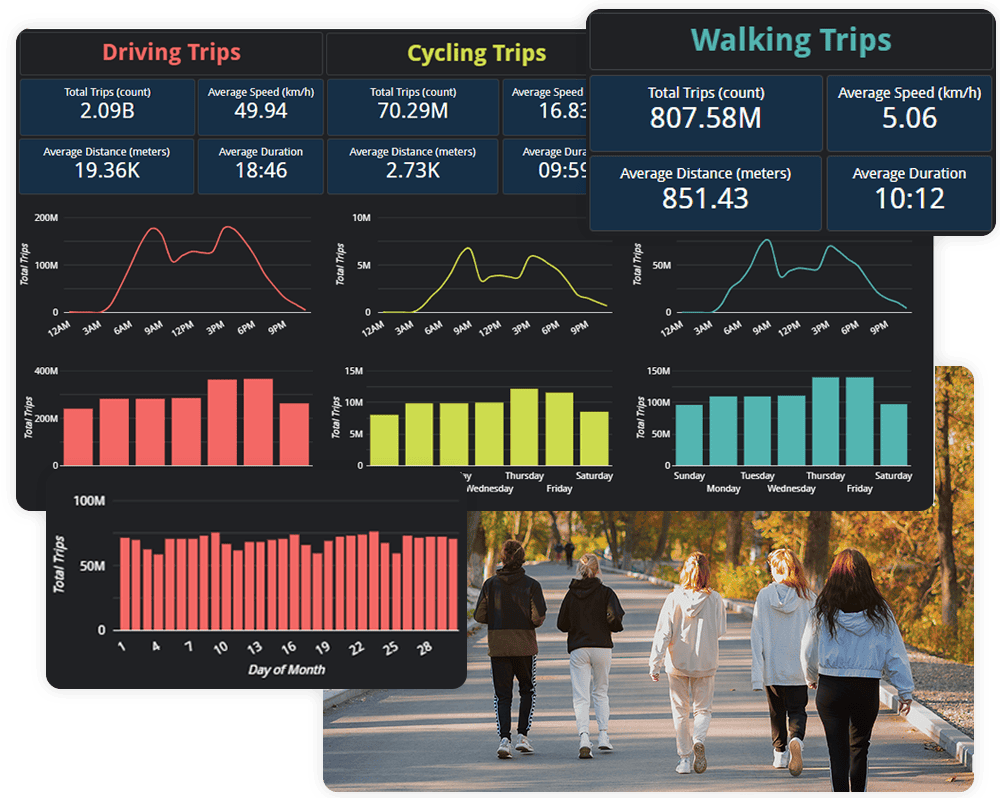
Understand overall travel behaviour across your region with a dashboard that aggregates billions of journeys to show how people move by walking, cycling and driving, helping you measure activity levels, infrastructure demand and travel patterns.
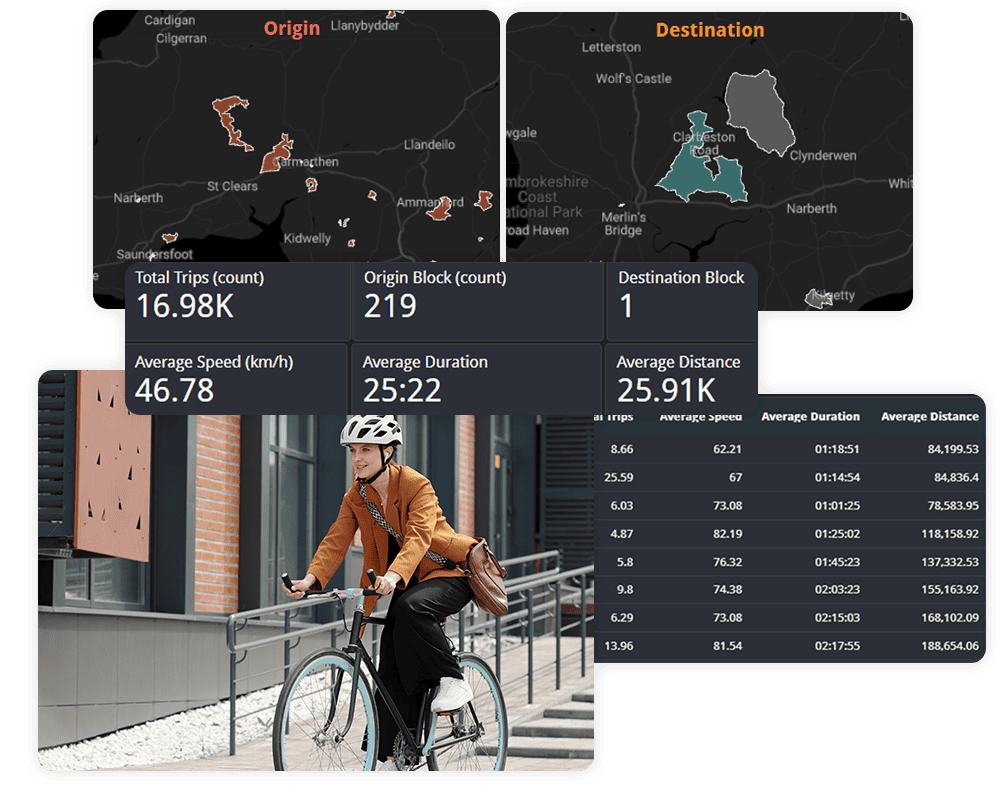
Dive deeper into how trips connect specific places of interest. The Origin–Destination dashboard enables full interrogation of journey patterns between any locations.

The Municipality of Ritchot partnered with ActiveXchange to gain a clearer, data-driven understanding of how residents and visitors use its parks, trails and community facilities throughout the year.

As the City of Thunder Bay continues to invest in placemaking and community activation at Prince Arthur’s Landing, understanding how people engage with this space has become increasingly important.

Festival planners needed a more precise and scalable way to quantify the event’s growing impact, while also optimizing resource allocation and making data-driven decisions for future planning.
A Visit Report is ActiveXchange’s most popular Movement Data product, which is a comprehensive breakdown how people use and move through any space/s or location/s of your choice.
Visit reports include a number of outputs, including:
We also have a number of optional add-ons such as:
Principally, our movement insights are powered by GPS data from mobile device applications, with additional data coming from a mixed range of sources including wifi hotspots, bluetooth beacons, IOT sensor networks, and connected vehicles.
We ingest data from millions of unique devices.
We use this huge data-set, and combine it with other available contextual information such as data from lookalike locations, or any available ground-truth sources, to train unique models which generate accurate visitor insights which are included in our visit reports.
Yes, all data from visit reports can be downloaded in .csv format for further analysis.
A polygon in this context is simply a shape on a map which clearly defines the space that you are interested in generating insights for.
Our technology utilises the GPS function of mobile devices, which is a different technology than that used to generate a phone signal, and is therefore unaffected by rurality.
GPS accuracy can be affected by factors such as buildings, dense foliage (trees), and mountains.
Visit reports can be purchased in 12-month intervals, from 2022 onwards.
You can order ongoing reporting, which will be updated quarterly throughout your agreement period.
There are no restrictions on size or shape of polygons, but we are able to provide advice and guidance on factors to consider when making these decisions. Understanding the intended application of the insights generated can be important in creating polygons which serve the intended purpose.
If a single road passes through a polygon then we can remove this data from the analysis. However, multiple roads or polygons with complex transport infrastructure located within it should be avoided.
Please discuss this with a member of the team if you are unsure as we will be happy to help.
Visit estimates can vary in accuracy, depending on a range of factors.
We do not have data from every mobile device, nor every person, who physically enters the polygon. Therefore, the visit estimates we generate are modeled in each instance, with a bespoke model created for each polygon.
These models are trained and optimised by considering a range of parameters, such as: comparable locations with known counts of people, any available ground-truths from sources such as footfall counters or clicker counts, or ticketed event data.
With our vast experience and growing body of comparator sites across the globe, we are confident that our visit estimates range in accuracy from 70%-90%.
The heat map shows how individual devices have moved around the place of interest, during the reporting period. It helps to answer questions like:
In consideration of privacy laws, ActiveXchange does not collect any PII. ActiveXchange collects and analyses relevant, non-PII, anonymised, and aggregated data about people over time and across different services, including geo-location data from mobile devices.
Mobile publishers who partner with ActiveXchange are required to implement opt-ins and opt-outs, as may be required by applicable data privacy laws and standards, to obtain affirmative consent from end users, before collection or receipt of such data from the mobile apps and web apps.
ActiveXchange can guarantee that data activities are fully compliant with all applicable data privacy laws and standards worldwide, including, without limitation, the following: GDPR, PDPA, LGPD, CalOPPA, CCPA.
ActiveXchange’s priority at all times remains data security and data privacy. Our latest SLA is available on request, along with our IT and Data policies. The majority of ActiveXchange’s services run on the Microsoft stack and data is held on domestic servers.
We are able to provide detailed insights about visits and visitors, to specific events, including visit estimates and identifying the home location of visitors.
“We can now better determine the tourism values of non-ticketed events utilizing data gathering from ActiveXchange, a tool that supports better tourism value determination and helps plan for future growth.”
Manager of Tourism – City of Thunder Bay

“A very exciting (and essential) addition to our Year-round Community Tennis program as we work hard to increase tennis infrastructure across Canada.”
Manager of Community Projects – Tennis Canada

“Absolutely brilliant, instantaneous access to user data that eliminates all guess work from evidence-based safety recommendations for community members. This data assists us to make best practice decisions for communities.”
Aquatic Research Educator – Drowning Prevention Auckland
Book a demo and we’ll show you what Movement Data can reveal about your places, spaces and active environments.